Miroslav Holík1 and Josef Halámek2
1Department of Theoretical
and Physical Chemistry, Faculty of Science,
Masaryk University, Kotlářská 2, CZ 611
37 Brno, Czech Republic,
2Institute of Scientific Instruments, Academy of Sciences
of the Czech Republic,
Královopolská 147, CZ 612 64 Brno, Czech Republic
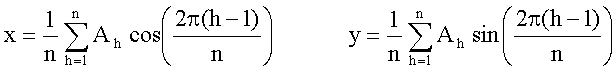
For the quantitative determination whole spectrum or its significant part can be used. Then the mathematical procedure comprises either a multivariate calibration or a nonparametric estimation [1]. However, simple inspection of spectra by eye is not enough for checking the quality of the method and a way leading to graphical presentation of the whole spectral line as a point in two-dimensional space has been developed. This can be achieved by transforming the spectral curve into two coefficients x and y according to the following equations:
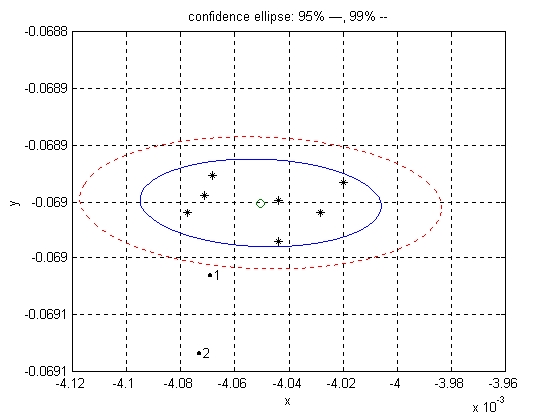
These are in fact real and imaginary parts of the first complex number after the Fourier transform of the spectrum. All points from repeated measurement can be surrounded by confidence ellipses at 95 a 99% probability levels.
1) checking repeatability of measurements - instrument precision,
2) eliminating obvious outliers or systematic errors,
3) selecting the most suitable part of spectra for quantitative analysis,
4) finding the lowest detectable concentration of analyte - limit of detection (see Figure),
5) estimating deterministic and stochastic noise,
6) comparing sensitivity of different methods of measurement.