Figure 1. Structures of the stationary phases with isolated functional
groups
A. Dallos1, K. Héberger2, S. Kemény3
1 University of Veszprém, H-8201 Veszprém, P.O. Box 158,
Hungary
2 Chemical Research Center HAS, H-1525 Budapest, P. O. Box.
17, Hungary
3 Budapest University of Technology and Economics, H-1521
Budapest, P.O.Box 91, Hungary
The absolute retention data obtained by gas-liquid chromatography are characteristic to the solute-solvent interactions. Recently, a series of interacting groups are have been proposed for characterizing different types of intermolecular forces such as dispersion- and polar-type interactions by measuring gas-liquid partitioning. The measuring measurement system consists of a family of solvents shown in Fig. 1, having molecules of the same size and form as quasi isochor stationary phases in gas chromatography. The family includes a standard paraffin, A = C78 (C78H158), and a series of polar compounds, P, in which an atom (H) or an atomic group (a methyl or an ethyl group) is substituted for by an interacting group. Using these solvents as stationary phases, gas chromatographic data for 150 solutes on a series of A/P mixtures were determined at several temperatures. and tThe desired thermodynamic data related to the gas-liquid equilibrium and to the solute-solvent interactions of different types were evaluated.

Figure 1. Structures of the stationary phases with isolated functional
groups
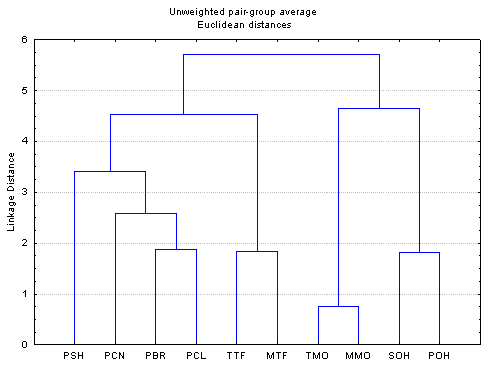
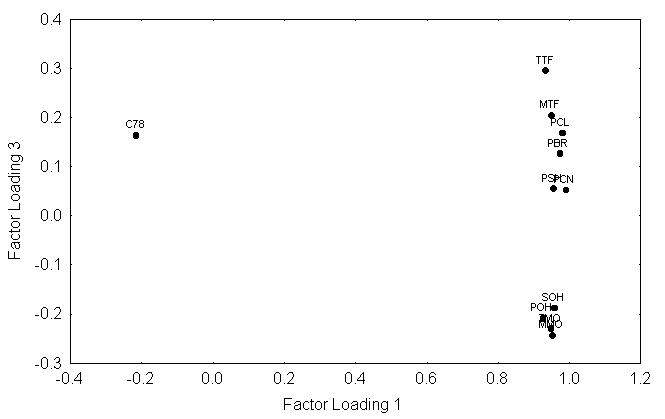
This work presents a chemometric study conducted on the extended set of interaction interaction-free enthalpies of 150 organic compounds with the standard paraffin and with seven “alonelonely-standing” interactive groups. HierarchialHierarchical clustering and principal component analysis (Fig. 2) were performed to detect structure in the relationships between amongst the retention data and to classify them. The statistical evaluation of the retention data explored the correlations of between the interaction interaction-free enthalpies of the solutes and the similarities/differences of the stationary liquids. Based on the chemometric data reduction a A set of chromatographic systems were was selected as possible new standards relating to LSERs and QSARs based on the chemometric data reduction.


Figure 2. Typical results of clustering and principal component analysis